
Heatmap Software Explained: What It Is & How It Works
September 14, 2026
What Is Heatmap Software?
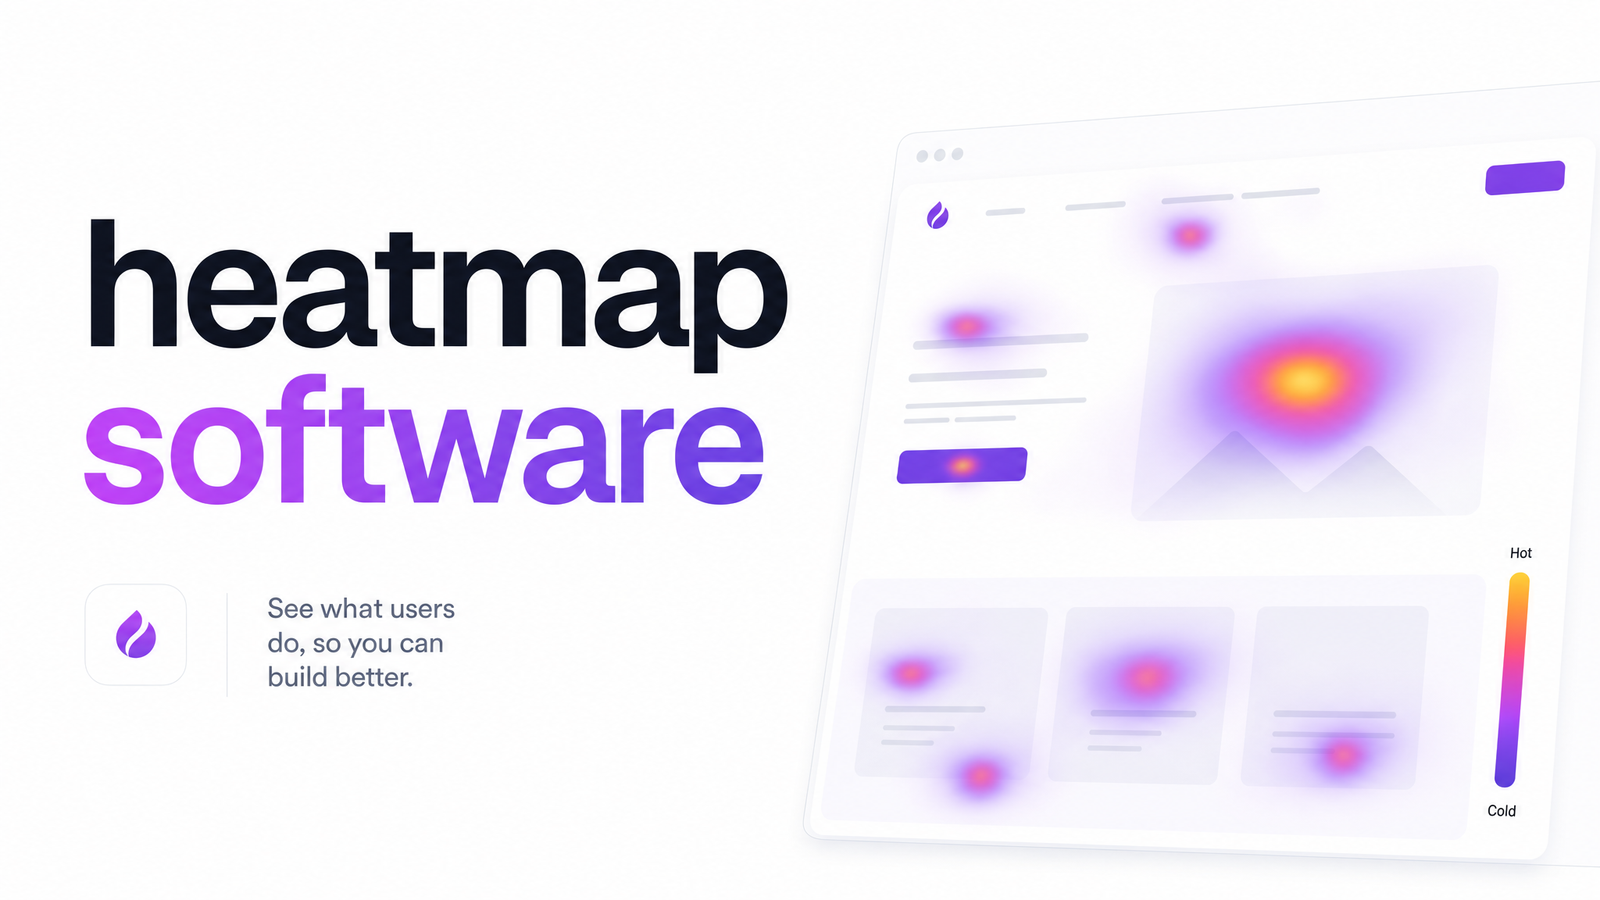
Heatmap software is a category of UX and conversion research tools that turns visitor behavior into a visual, color-coded overlay on top of your actual web pages. Where standard analytics reports numbers — pageviews, bounce rate, session duration — a website heatmap tool shows the shape of behavior: where people click, how far they scroll, and which parts of a layout draw attention versus get ignored.
The visual convention borrows from usability research popularized by Nielsen Norman Group: warm colors (red, orange, yellow) mark zones of high engagement, and cool colors (blue, green, or no color) mark low engagement or dead space. In short, heatmap software is a visualization layer that makes invisible on-page behavior visible, so you can diagnose UX and conversion problems that raw metrics can't explain alone.
How Heatmap Software Actually Works
Behind the visual, the mechanism is simple. A lightweight tracking script — typically a few lines of JavaScript — gets added to your site, similar to installing an analytics tag. Once live, it silently records interaction events for every visitor: where they click or tap, how far down the page they scroll, and, on desktop, how their cursor moves across the screen (a reasonable proxy for where eyes are looking).
Individually, one session's clicks and scrolls tell you almost nothing. The value comes from aggregation: the software blends thousands of these micro-interactions across many sessions into a single overlay rendered on top of the live page design — not by predicting behavior, but by accumulating enough real interaction data that patterns emerge on their own.
A well-built tracking script runs asynchronously, loading independently of your page's core content so it shouldn't block rendering or meaningfully affect load times. That said, script weight and loading behavior vary a lot between vendors, which is worth scrutinizing before you commit — more on that below.
The Core Types of Heatmaps (At a Glance)
Most platforms group data into three or four map types, each answering a different question:
- Click maps show exactly where visitors click or tap, including on elements that aren't actually clickable — a strong signal of confused expectations or, when clicks pile up on a dead element, "rage clicks" that flag real friction.
- Scroll maps reveal how far down a page visitors get before dropping off, invaluable for figuring out whether your key CTA or pricing table is actually being seen.
- Move/hover maps (attention maps) track cursor movement on desktop as an approximation of visual attention, useful for validating whether a layout draws the eye where you intended — echoing the classic F-shaped reading pattern documented in eye-tracking research.
Session replay — video-like recordings of individual visits — is a close cousin to heatmaps rather than a heatmap type itself, and many tools pair the two. For a full breakdown of how to interpret each map correctly, see the dedicated reading guide once you're past the conceptual stage.
Who Actually Needs Heatmap Software
The category serves several roles differently:
- Marketers optimizing a landing page use click and scroll maps to find out why a page converts poorly — is the CTA below the scroll line visitors actually reach?
- UX designers use move and attention maps to validate whether a redesign draws attention to the intended hierarchy, rather than relying on opinion.
- Agencies use heatmap software for client reporting, turning abstract recommendations into visual evidence a non-technical stakeholder can understand at a glance.
- Developers use click maps to catch dead clicks and rage clicks — signs that a button, form, or interactive element isn't behaving as expected.
The honest gut-check: heatmaps for UX work best once a page has meaningful, repeatable traffic. A page getting a handful of visits a month won't generate a pattern worth reading — you'll just be staring at scattered dots. If that's your situation, it's often better to fix obvious issues first and revisit heatmaps once traffic grows, or focus effort on higher-traffic pages elsewhere on the site.
What to Look For When Choosing Heatmap Software
Evaluating heatmap software features comes down to a short checklist:
- Map coverage — does it support click, scroll, and move/attention maps, or only one or two?
- Session replay pairing — can you jump from a heatmap straight into replays of the sessions that generated it?
- Sampling vs. full-traffic capture — some tools sample a subset of sessions to save resources, which can matter on high-traffic sites but skew results on lower-traffic ones.
- Privacy and cookie compliance — does the vendor support consent management and anonymized or aggregated data, particularly for GDPR-relevant audiences?
- Script weight and performance impact — a heavy or synchronous script can undercut the very conversion gains you're trying to capture.
- Pricing model — priced by pageviews, sessions, or seats, and whether it fits a single site or scales across an agency's client portfolio.
Choosing heatmap software is ultimately about matching these criteria to your traffic volume and use case, not chasing the tool with the most features on paper.
Heatmap Software vs. Standard Web Analytics
The most common point of confusion is treating heatmap software as a replacement for tools like Google Analytics. It isn't — the two answer different questions. Analytics tells you what happened numerically: how many visitors landed on a page, what your conversion rate was, where traffic came from. Heatmap software shows you why, visually: which section of the page visitors actually engaged with, where attention dropped off, and what got clicked instead of the intended CTA.
Used together, they form a loop — analytics flags which pages underperform, and heatmap data explains the behavioral reason. This pairing is a core input into any conversion rate optimization audit, and understanding it is what separates teams that guess at fixes from teams that diagnose them.
Next Steps: From Understanding to Implementing
Once the concept is clear, the natural path is: choose a tool suited to your traffic and use case, install the tracking script, then learn to read the resulting maps correctly — including how those insights translate into UX design decisions that move metrics. If you're ready to get started, the 15-minute setup guide walks through implementation step by step.
If you'd rather see the concept in action first, try the Optimevra live demo — or explore pricing once you're ready to evaluate. For a broader look at what the platform does, visit Optimevra.
Frequently Asked Questions
Is heatmap software the same thing as Google Analytics?
No — they're complementary, not interchangeable. Google Analytics reports numerical metrics like traffic volume and conversion rate, while heatmap software visualizes on-page behavior such as clicks, scrolling, and cursor movement so you can see the "why" behind those numbers.
Does heatmap software slow down my website?
A well-built tracking script loads asynchronously and shouldn't meaningfully affect page speed. However, script weight and loading behavior vary between vendors, so it's worth checking performance impact before committing to a tool.
How much traffic do I need before heatmap data is reliable?
There's no fixed number, but heatmaps need enough repeated visits to a page to form a legible pattern rather than a handful of scattered data points. Very low-traffic pages generally aren't a good fit until traffic grows or you consolidate analysis on higher-traffic pages.
Can heatmap software track mobile visitors, not just desktop?
Yes, most modern heatmap tools track taps and scroll depth on mobile in addition to clicks and cursor movement on desktop. Move/attention maps are desktop-specific since they rely on cursor tracking, but click and scroll maps typically work across both.
Is heatmap software safe from a privacy/GDPR standpoint?
It can be, provided the vendor supports consent management and aggregates or anonymizes interaction data rather than tying it to identifiable individuals. This should be part of your evaluation checklist, not an afterthought.
What's the difference between a heatmap and a session recording?
A heatmap aggregates thousands of sessions into one visual overlay showing collective behavior patterns, while a session recording (or replay) is a video-like playback of a single individual visit. Many platforms pair the two so you can spot a pattern in a heatmap, then watch specific replays to understand exactly what happened.
Originally published on Rankevra.