
Hotjar Heatmap Explained: How It Works & Where It Falls
August 19, 2026
What Is a Hotjar Heatmap?
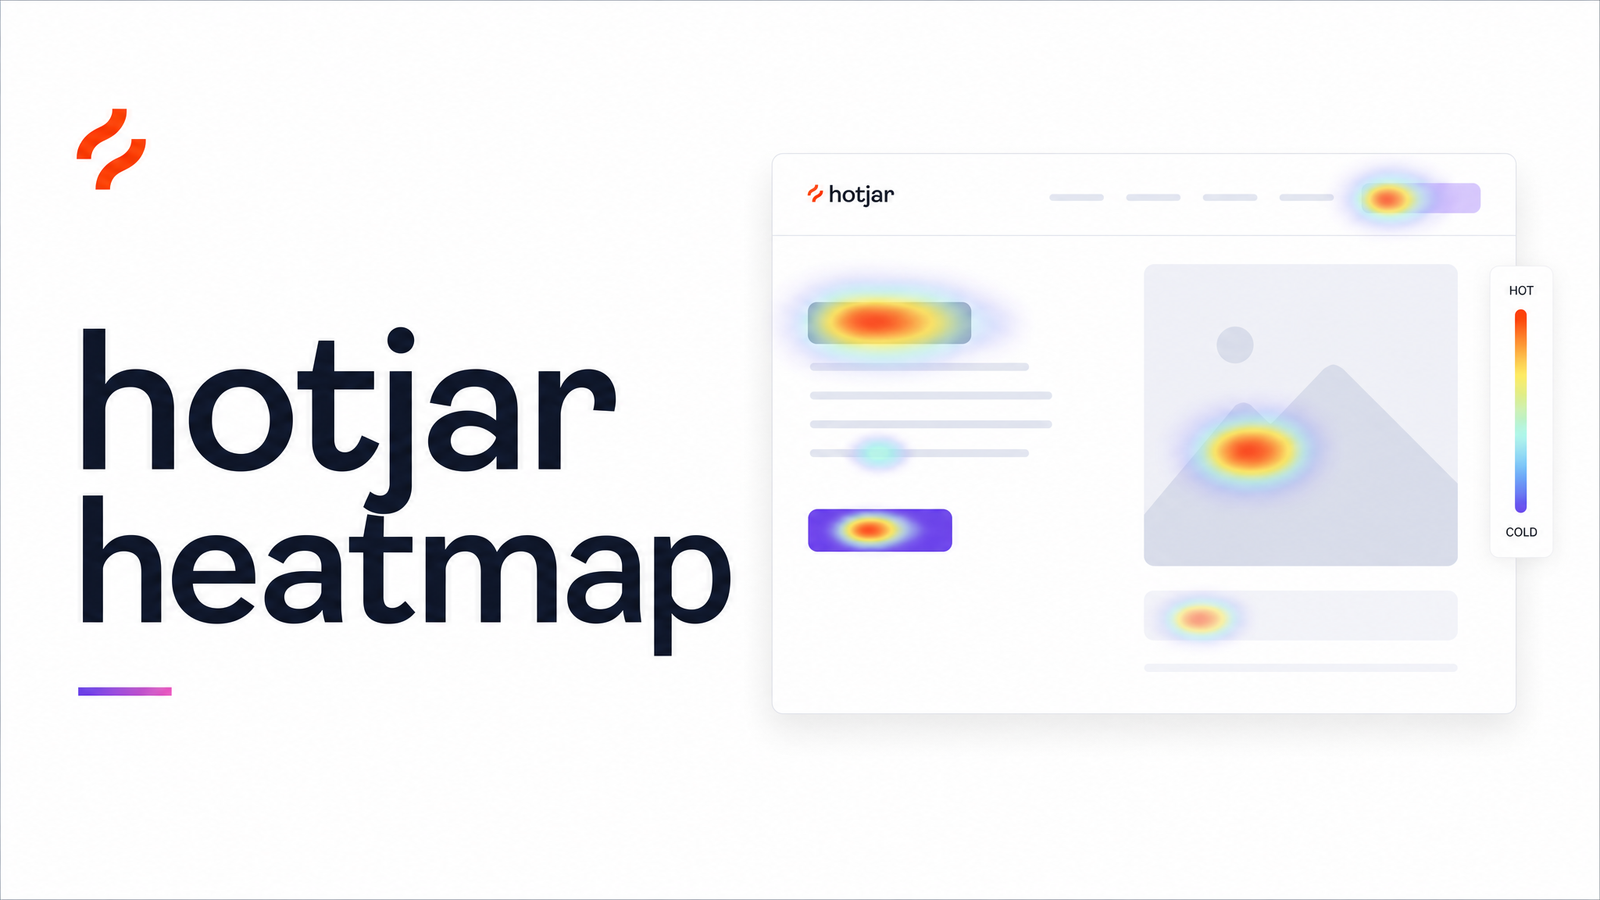
A Hotjar heatmap is a visual overlay showing where visitors click, move their cursor, and scroll on a webpage, rendered as color gradients on a screenshot of that page. Warm colors (red, orange) mark high-activity zones; cool colors (blue, green) mark areas visitors mostly ignore. In practical terms, it's a way to see user behavior without watching individual session recordings one by one.
Hotjar generates four types of maps — click/tap, move, scroll, and engagement zone — each capturing a different behavioral signal. Site owners, marketers, and agencies use them to answer basic but important questions: Are people noticing the CTA button? Does anyone scroll past the fold? Is the hero image eating clicks meant for the nav bar? That feedback is genuinely useful — it's also, as we'll get into, only part of the picture.
The 4 Types of Hotjar Heatmaps Explained
Click maps (or tap maps on mobile) record every click or tap on a page, showing which elements draw interaction and which get ignored. A Hotjar click map is especially good at surfacing "false affordances" — elements that look clickable but aren't, or buttons visitors expect somewhere they don't exist. For a deeper look at what click data measures and how to act on it, see this breakdown of click tracking.
Move maps track cursor movement on desktop, operating on the (imperfect but reasonably validated) assumption that eye movement often follows mouse movement. A move map is useful for spotting which sections of a page draw visual attention, even without a click.
Scroll maps show how far down a page visitors get before dropping off, displayed as a fading gradient. A scroll map answers the "does anyone see this content" question — if your pricing table sits at 90% scroll depth and only 15% of visitors reach it, that's a placement problem, not a design problem.
Engagement zone maps are Hotjar's newer aggregate view, grouping page sections by combined click, move, and scroll activity into a single engagement score per zone — a faster way to scan a page for hot and cold areas without toggling between three separate overlays.
How Hotjar Heatmaps Actually Work
Understanding how a Hotjar heatmap works explains why it sometimes produces confusing results. When you install the Hotjar tracking code (a JavaScript snippet added to your site's ), it silently records cursor coordinates, click events, and scroll depth as visitors interact with the page. Hotjar also captures a static screenshot of the page's rendered HTML/CSS to use as the background layer the heatmap sits on top of.
That screenshot step matters: Hotjar isn't watching a live, interactive version of your site — it's stitching together a snapshot of the DOM at a point in time and overlaying aggregated behavioral data on it. When that snapshot doesn't match what real visitors actually saw (different content loaded, different viewport, different state), the heatmap gets visually misleading even though the underlying click and scroll data is accurate.
Where Hotjar Heatmaps Fall Short
This is the part most vendor content skips, but it's documented and worth knowing before you trust a heatmap as gospel. Several limitations stem directly from that screenshot-based rendering approach:
- Iframes render as black boxes. Embedded content — video players, third-party widgets, some payment forms — often shows up as a blank or black rectangle in the heatmap screenshot, even though clicks inside it were technically recorded.
- A roughly 10MB HTML capture limit. Very large, content-heavy pages can exceed what Hotjar's screenshot mechanism captures cleanly, leading to partial or broken renders.
- Lazy-loaded and dynamic content is unreliable. Elements that load on scroll or interaction (infinite feeds, tabbed content, modals) may not appear in the background screenshot at all, or may appear in the wrong state.
- Parallax effects and scroll-locking distort scroll maps. Because scroll maps rely on a single static representation of page length, pages using parallax or JS-driven scroll hijacking can produce scroll data that doesn't map cleanly to what users actually experienced.
- Mobile tracks taps and scrolls only — not pinch-zoom, swipe gestures, or orientation changes. If you're troubleshooting a heatmap not working correctly on a responsive site, mobile rendering differences are a common root cause; our mobile-friendliness check covers device-specific fold and viewport issues that heatmaps can't see.
None of this makes heatmaps useless — it means gaps and odd renders should be treated as a data-quality flag, not automatically as a UX problem.
Hotjar Heatmap Pricing in 2026
Since Hotjar's merger with Contentsquare, its heatmap functionality now lives under the Contentsquare Experience Analytics product line, with paid plans starting around $49/month. A free tier still exists, but it comes with capped sessions and limited historical data storage — enough to test the concept on a low-traffic site, not enough for ongoing analysis at scale. Teams running real traffic volumes will hit those limits quickly and need to budget for a paid tier to get usable sample sizes and longer data retention.
From Heatmap Data to Action: What Hotjar Doesn't Tell You
Here's the gap nobody selling heatmap software wants to dwell on: a heatmap shows you where users struggle, not why, and definitely not what to fix first. A cold zone around your CTA could mean weak copy, poor color contrast, an accessibility issue keeping keyboard or screen-reader users from reaching it, or a performance problem where the button hasn't finished rendering when users try to click it. The heatmap looks identical in all four cases.
That's the real question behind "what to do with heatmap data" — you still need to diagnose the cause, cross-reference it against accessibility and performance factors, and decide what's worth fixing given your time and dev resources. Manually correlating a heatmap against a Lighthouse report, a WCAG checklist, and your conversion funnel is possible, but it's slow and easy to get wrong.
If you're evaluating a Hotjar heatmap alternative — or just want the missing layer on top of what Hotjar already shows you — that's precisely the gap Optimevra is built for. Instead of a visual overlay you have to interpret by eye, Optimevra scans your site and returns a prioritized, AI-generated list of specific UX, accessibility, performance, and conversion issues, ranked by impact.
Heatmaps are a solid first diagnostic layer — they're honest about where attention is going. They just stop short of telling you what to actually build or fix next. Run your site through Optimevra's live demo to get that prioritized list automatically, or check current plans if you're ready to move past manual interpretation. Learn more at Optimevra.
Frequently Asked Questions
Is Hotjar's heatmap tool free to use?
Hotjar offers a free tier, but it's capped on session volume and historical data retention. Paid Experience Analytics plans through Contentsquare start around $49/month for higher session limits and longer data storage, which most sites with meaningful traffic will need.
Why is my Hotjar heatmap showing no data or a black box?
Black boxes usually mean an iframe-embedded element (video, widget, form) that Hotjar's screenshot mechanism can't render. Missing data more broadly often traces back to lazy-loaded content not appearing in the static screenshot, pages exceeding the roughly 10MB HTML capture limit, or too few recorded sessions to generate a visible pattern.
What's the difference between a click map and a move map in Hotjar?
A click map records actual clicks or taps, showing exactly what visitors interacted with. A move map tracks cursor movement across the page, used as a proxy for visual attention even when no click occurs — useful for spotting what draws the eye without necessarily driving action.
How many sessions does Hotjar need before a heatmap is reliable?
Hotjar doesn't publish a strict minimum, but general practice suggests at least a few hundred sessions per page before patterns become statistically meaningful. Low-traffic pages will show sparse, noisy heatmaps that can mislead more than inform.
Does Hotjar track heatmaps on mobile the same way as desktop?
No. Mobile heatmaps only capture taps and scroll depth — they don't track gestures like pinch-zoom, swipes, or orientation changes the way desktop move maps track cursor position. This gap makes mobile heatmap data inherently less detailed than desktop data.
What should I do after finding a problem area on a Hotjar heatmap?
Treat the heatmap as a starting point, not a diagnosis — investigate whether the issue stems from copy, layout, accessibility barriers, or performance delays before making changes. Cross-referencing the flagged area against an accessibility and performance audit, such as the prioritized issue list Optimevra generates, turns the observation into an actionable fix.
Originally published on Rankevra.