
Smartlook Heatmap Guide (Plus the 2026 Wind-Down)
September 23, 2026
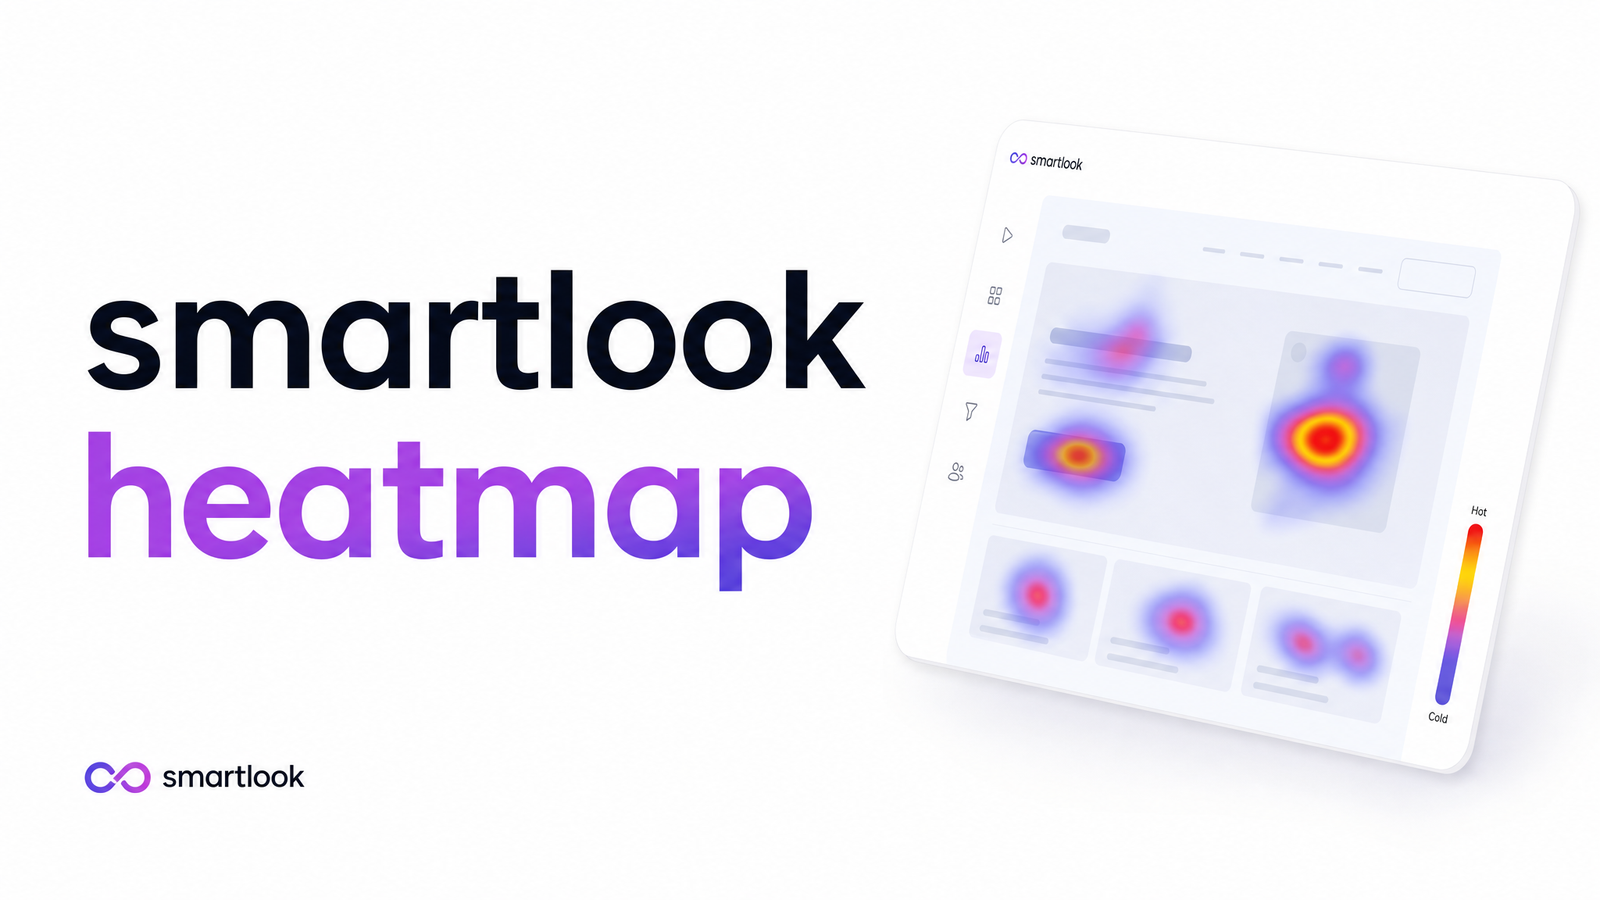
If you're researching a Smartlook heatmap in September 2026, you need one fact first: Smartlook is being wound down by Cisco, with new sales already cut off and existing contracts on a fixed countdown. Clicks, scrolls, and attention data still matter — but less than knowing whether the tool will exist next year.
What Is a Smartlook Heatmap?
A Smartlook heatmap is an aggregated visual layer — built from many individual visitor sessions — overlaid on a screenshot of a page to show where attention and interaction concentrate. Instead of watching one person move through your site, you see a color-coded summary of what dozens, hundreds, or thousands of visitors did in the same area: red and orange mark high concentrations of clicks or attention, cooler colors mark areas visitors mostly ignored.
This differs from session recordings, which Smartlook also offers. A recording plays back one visitor's actual journey in real time. A website heatmap tool instead compresses many sessions into a single static image, trading individual context for pattern recognition at scale. Use recordings to understand a specific confusing moment; use a heatmap to see whether that moment is a one-off or a widespread pattern.
The 3 Types of Smartlook Heatmaps: Click, Move, and Scroll
Smartlook builds three heatmap types, each answering a different question.
Click maps show exactly where visitors clicked or tapped, revealing interaction intent. If a click map lights up on a non-clickable image or static text styled like a button, that's a strong signal visitors expect functionality that isn't there.
Move maps track cursor movement — a reliable proxy for visual attention on desktop — showing where focus lingers before a click happens. Heavy hovering over a pricing table without clicks below it often means visitors are reading closely but hesitating, not ignoring the section.
Scroll maps show how far down a page visitors travel before leaving, marking the depth at which most of your audience drops off. If a scroll map shows 70% of visitors never reaching your CTA, no amount of copy polish will fix the real problem — placement.
Understanding click map vs scroll map differences is key to reading Smartlook data correctly: clicks tell you what people acted on, scroll tells you what they never reached, and move hints at what drew focus before any decision was made.
How the Data Is Generated (and How Much You Need)
Heatmaps are built by aggregating recorded session data tied to a specific URL, so reliability depends heavily on volume and how URL matching is configured. Smartlook requires a minimum number of recorded page views before it will render a heatmap at all — pages with too little traffic won't have enough data points for a meaningful visual, which is the most common reason a smartlook heatmap not showing data turns out to be a traffic problem rather than a tracking bug.
Two settings shape accuracy significantly. Smartlook heatmap precision settings control how tightly click/move data clusters — higher precision needs more sessions to look clean, while lower precision smooths sparse data into broader, less exact zones. Separately, URL matching mode determines what counts as "the same page": exact matching only pools sessions from an identical URL, while simple/pattern matching groups similar URLs together (useful for pages with tracking parameters or dynamic IDs, but risky if it lumps different pages into one map). Filters — by device, traffic source, or date range — let you segment further, but every filter shrinks the sample size and can push a page below the threshold needed for a trustworthy view. According to Smartlook's own documentation, these mechanics are the same regardless of plan tier — what changes with pricing is how many heatmaps and sessions you're allowed to generate.
Smartlook Pricing for Heatmaps: Free vs Paid Limits
Heatmaps are available on Smartlook's free plan, but with caps on monthly session volume and the number of heatmaps you can keep active at once. Paid Pro and Enterprise tiers raise those session ceilings substantially and remove the cap on simultaneous heatmaps, which matters if you're auditing many landing pages rather than one or two. The free plan is fine for testing the feature on a single high-traffic page; ongoing, multi-page optimization work will bump into limits quickly. Given the news below, any new investment in smartlook pricing tiers deserves a second look before you commit budget.
Important: Smartlook's 2026 Wind-Down and What It Means for Your Heatmaps
Is Smartlook shutting down? Effectively yes, on a defined schedule. Cisco, which acquired Smartlook, has confirmed an End-of-Sale date of May 31, 2026, after which no new Smartlook subscriptions or upgrades can be purchased. Existing customers can renew current contracts only through August 31, 2026, and the platform is scheduled for full decommission on September 30, 2027. Functionality is expected to migrate toward Splunk's Digital Experience Analytics within Cisco's broader observability suite. Both Cisco's official bulletin and Smartlook's own contact page confirm these dates directly.
If you're an existing user: export your historical session and heatmap data now, don't count on renewing past August 31, 2026, and start evaluating a Smartlook alternative before that window closes. If you haven't signed up yet, the End-of-Sale timeline should factor heavily into whether it's worth onboarding a tool with a fixed shutdown date at all.
What a Heatmap Can't Tell You
A heatmap describes behavior; it doesn't explain it. A hot click zone shows where users acted, but not whether they succeeded — a heavy cluster of clicks on a form field can mean genuine engagement or that the field is broken and visitors are retrying it out of frustration. Heatmap limitations become obvious once you ask why users aren't converting: a scroll drop-off could stem from slow load times, poor color contrast, broken viewport scaling on mobile, or accessibility barriers blocking assistive-technology users entirely. None of that shows up as color on a screenshot. For a closer look at the specific accessibility failures visual data misses, see Accessibility Checker for Website: What It Really Catches.
This is exactly the gap Optimevra's automated audits are built to close — pairing behavioral patterns with concrete diagnostics on UX, accessibility, and performance so you know not just where visitors clicked, but why the page underperformed in the first place.
Where Users Clicked vs. Why They Didn't Convert
A heatmap is descriptive, not diagnostic — it can't tell you whether a drop-off happened because of a slow-loading hero image, a contrast failure, or a broken mobile layout. For that diagnostic layer, run your URL through Optimevra's live demo to see the underlying issues a heatmap alone won't surface, compare options on the pricing page, or start at Optimevra for a broader look at what's costing your site conversions.
Frequently Asked Questions
How many sessions does Smartlook need before a heatmap becomes accurate?
Smartlook requires a minimum number of recorded page views on a URL before generating a heatmap, and results grow more reliable beyond that floor. Low traffic, tight URL matching, or added filters can all push a page below the usable threshold — the most common cause of sparse or missing heatmap data.
What's the difference between a click map, a scroll map, and a move map in Smartlook?
A click map shows where visitors clicked or tapped, revealing interaction intent. A move map tracks cursor movement as a proxy for visual attention, showing where focus lingers before a decision. A scroll map shows how far down the page visitors travel before leaving, exposing content drop-off depth.
Is Smartlook shutting down, and can I still sign up in 2026?
Smartlook is in active wind-down under Cisco, with an End-of-Sale date of May 31, 2026, after which no new subscriptions or upgrades can be purchased. Existing customers can renew through August 31, 2026, before full decommission on September 30, 2027.
What happens to my existing Smartlook data after the End-of-Sale date?
Your account and historical data remain accessible until the September 30, 2027 decommission date, but no further renewals are possible after August 31, 2026. Cisco has indicated functionality is migrating toward Splunk's Digital Experience Analytics, so exporting your session and heatmap data before deadlines pass is the safest move.
Can a heatmap tell me why users aren't converting, or just where they click?
A heatmap only shows where users clicked, hovered, or stopped scrolling — it can't explain the cause. Slow load times, poor color contrast, broken mobile scaling, or accessibility barriers can all drive the same drop-off patterns, but diagnosing them requires a separate audit layer.
Is Smartlook free to use for heatmaps, or do I need a paid plan?
Heatmaps are available on Smartlook's free plan, but with capped monthly sessions and a limited number of simultaneous heatmaps. Paid Pro and Enterprise tiers raise those limits and remove the cap on active heatmaps, which matters for teams optimizing multiple pages at once.
Originally published on Rankevra.